Empower your operations
Telecom Networks are fragmented: multi-vendor, multi-layered, multi-technology and multi-services. An accurate, end-2-end operational inventory can streamline your operations. Networkmining probes your network, and builds the most accurate representation of your network based on discovered information instead of human-input.
Discover how Networkmining empowers your Operations: service planning and design, service assurance, root-cause analysis, single-point-of-failure, capacity management and more.
The power of Networkmining
Discover
By probing your network and connecting datasources, Networkmining discovers the “single version of truth”.
From physical fiber, 5G, MPLS, IP, SDH, PDH, VPN to customer information.
Our out-of-the-box probes are unparalled in quality: no data can be more accurate than discovering what’s in the field.
Higher up-time and reliability
Discover single-point-of-failures.
Accelerate root-cause analysis by correlating alarm information.
Connect logical/active to physical/passive inventory.
Predict impacted redundancy and/or customers when planning maintenance/upgrades.
Reduce time to repair.
Model & understand
Discovered information is used to build a digital model of your network. The data is accessible for your teams and developers to integrate in your OSS/BSS eco-system.
Powerful visualisations of your network enable a deeper understanding of “what’s in your network”. Geoschematical, logical, front-panel of devices, … can support your teams.
Integrate
A powerful API and open datamodel allow your teams to use the accurate inventory for other solutions, processes and teams.
Accurate inventory is the first step towards automation and orchestration.
Networkmining provides this building block to empower your future.
Dynamic views
When you are browsing your network to understand how elements are connected, and interpret underground containment, the map often doesn’t offer everything that’s needed to gather all critical information.
The Dynamic Views in Marlin offer a more cohesive user experience, adding additional details alongside the map, augmenting the display to provide a comprehensive set of information.
What’s more, these additional views are always linked to the map, to enable a truly dynamic, fully synchronized experience.
Can your GIS do that?
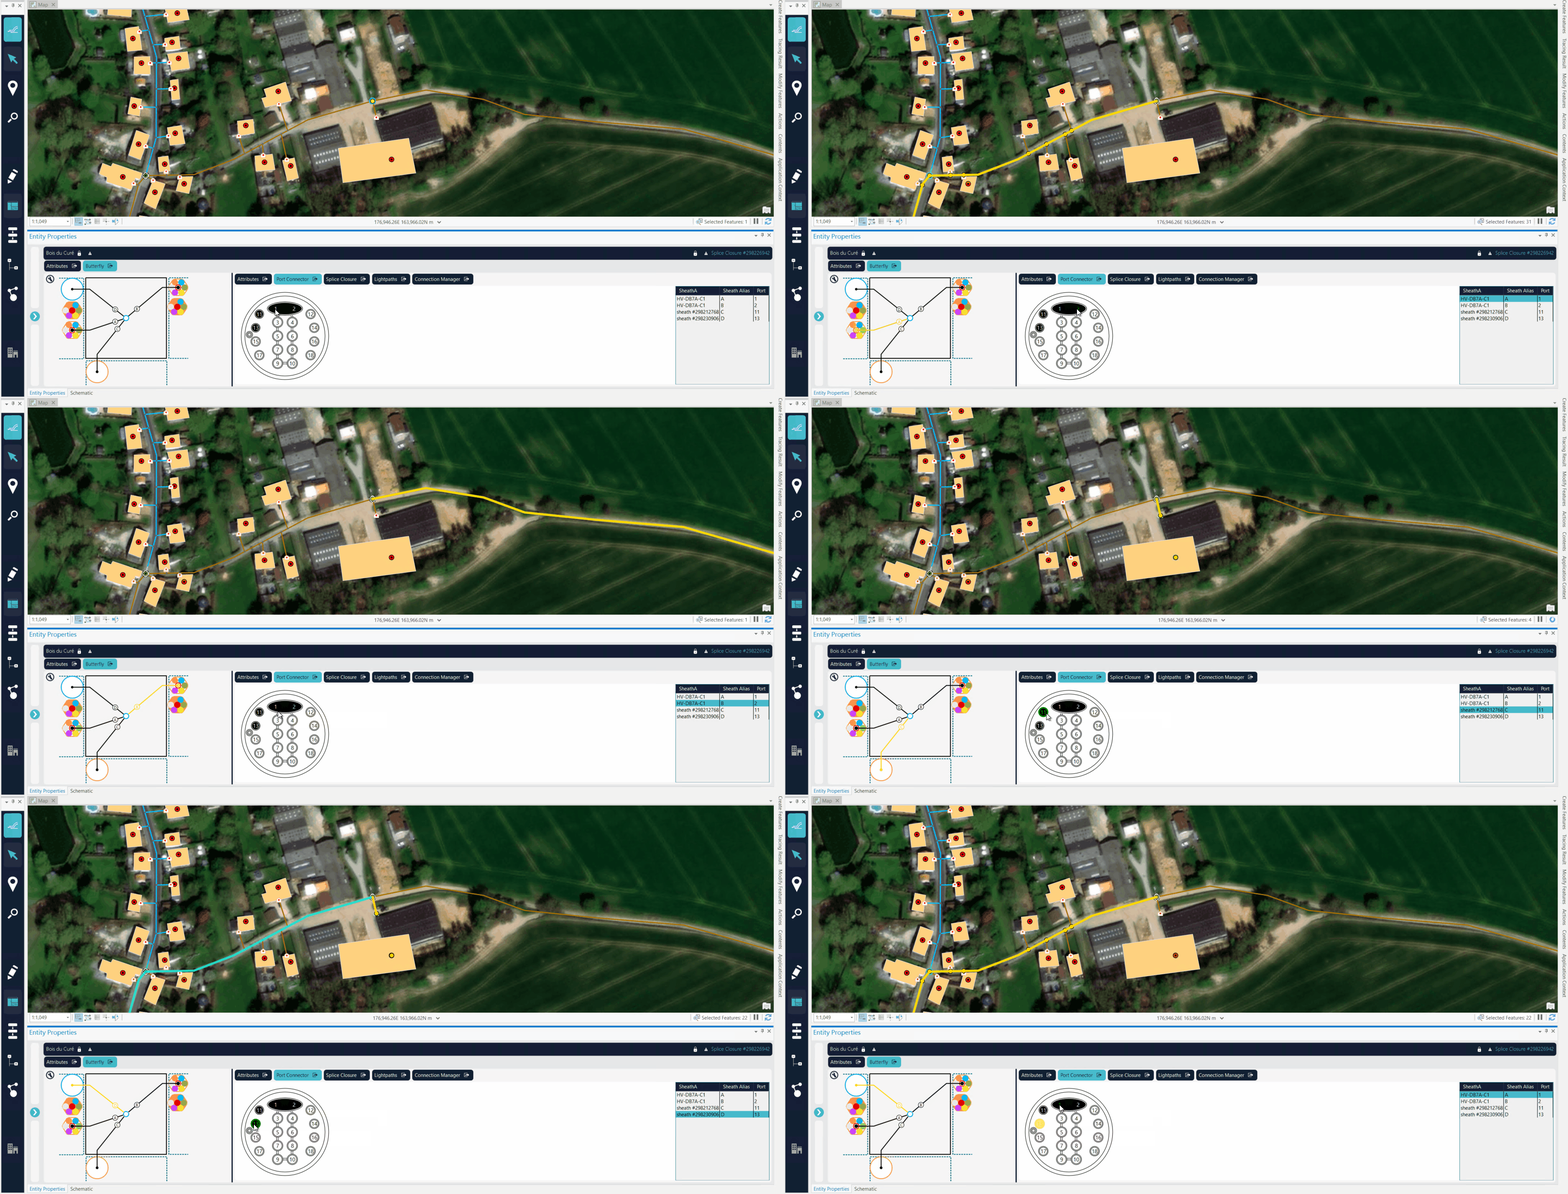
In this example, you see the content of manhole with an optical splice closure (OSC) where 4 cables (A, B, C, D) are connected. The butterfly on the bottom left shows which cables go North, East, South or West. The Port Connector view shows how the cables (A, B, C, D) are guided into the OSC through ports 1, 2, 11 and 13. All views are linked: when you click on a port, the cable is highlighted on the map and the butterfly.
The Marlin Datamodel simplifies your network to routes and structures, and manages the complex infrastructure relationships of millions of records, without sacrificing performance. Marlin can even tap into legacy solutions to ensure that you can manage a multi-vendor environment easily. An accurate inventory allows Marlin to generate schematics on-the-fly so you always have up-to-date insights.
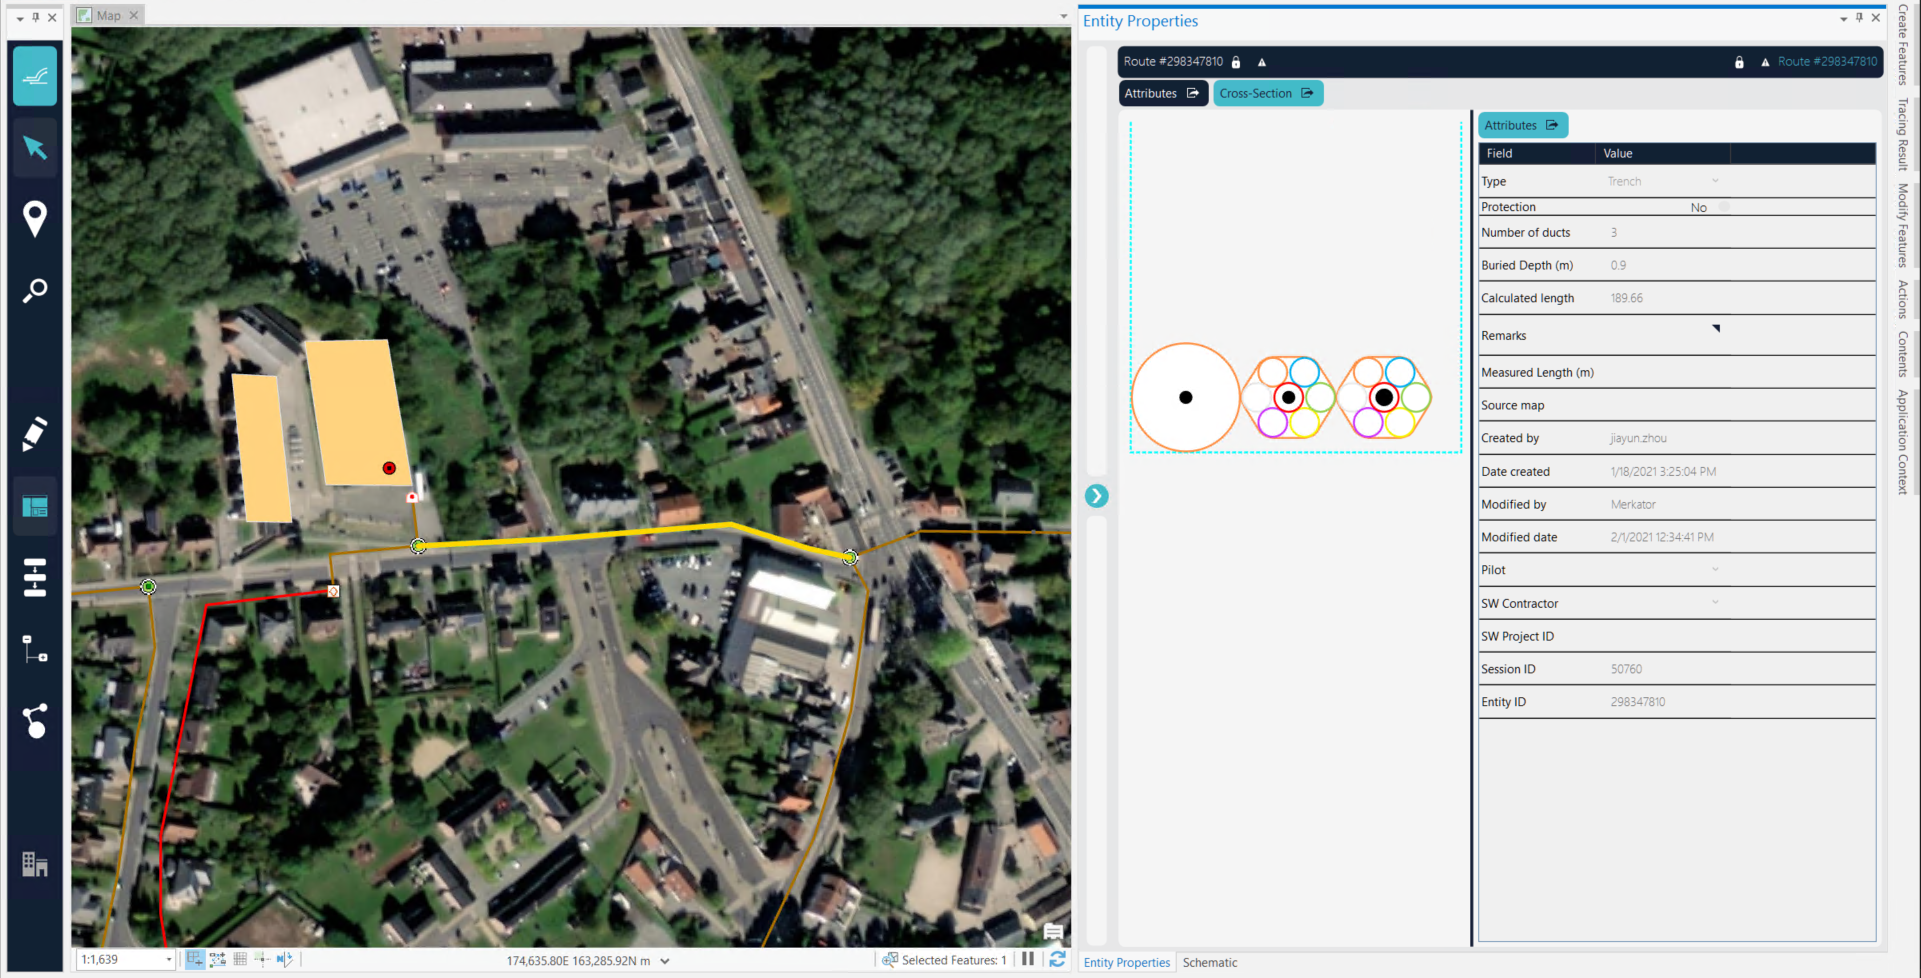
In this example, you click a route and Marlin shows what is inside this trench. On the right, you see the “cross section” of this trench with a cable and two ducts with 7 miniducts inside. Two of these miniducts are occupied with another cable.
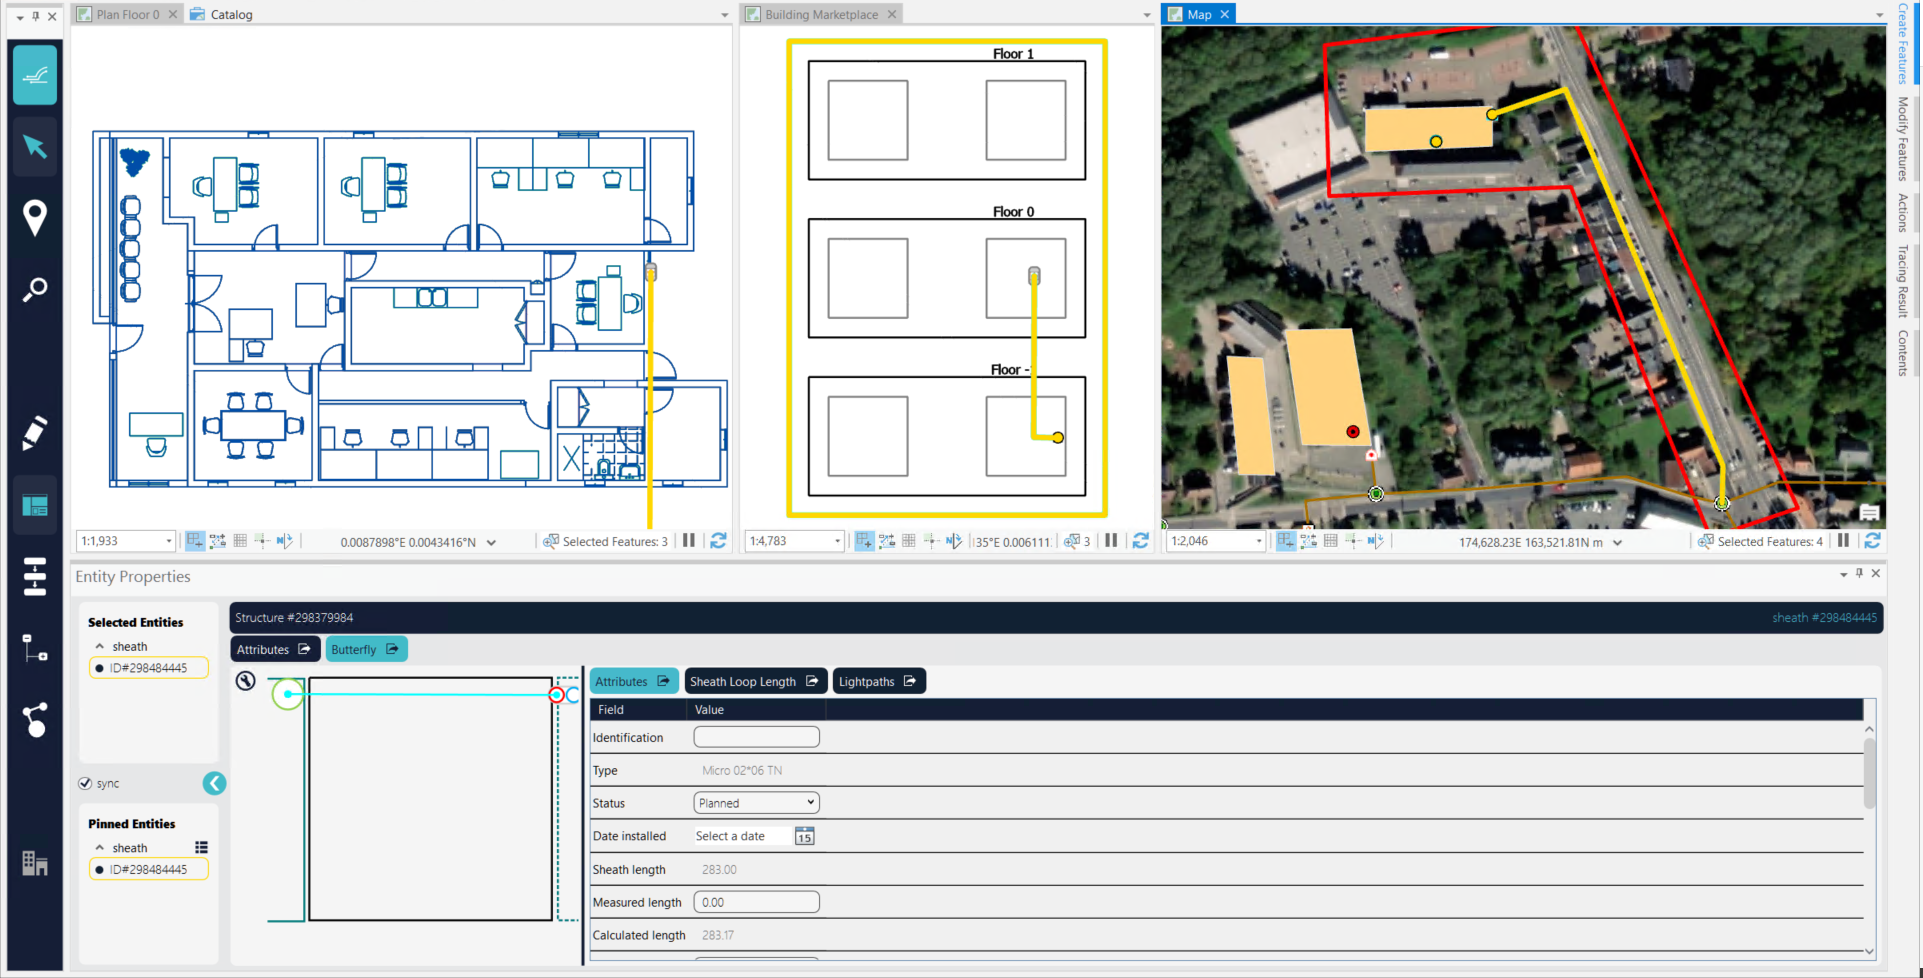
In this example, you click a cable and see the connection running from outside to the inside of a building. The top-left view shows the floorplan in DWG and how the highlighted cable runs from the basement to the ground floor. The bottom left view shows the access point and how the outside cable continues inside.
This powerful detail illustrates fully synchronized outside and inside plant capabilities, including seamless tracing invoked from either domain!
Marlin eliminates opportunities for documentation to become out of date in many ways, but here is another great example.
Traditionally, we see that schematics are managed in spreadsheets and become rapidly outdated.
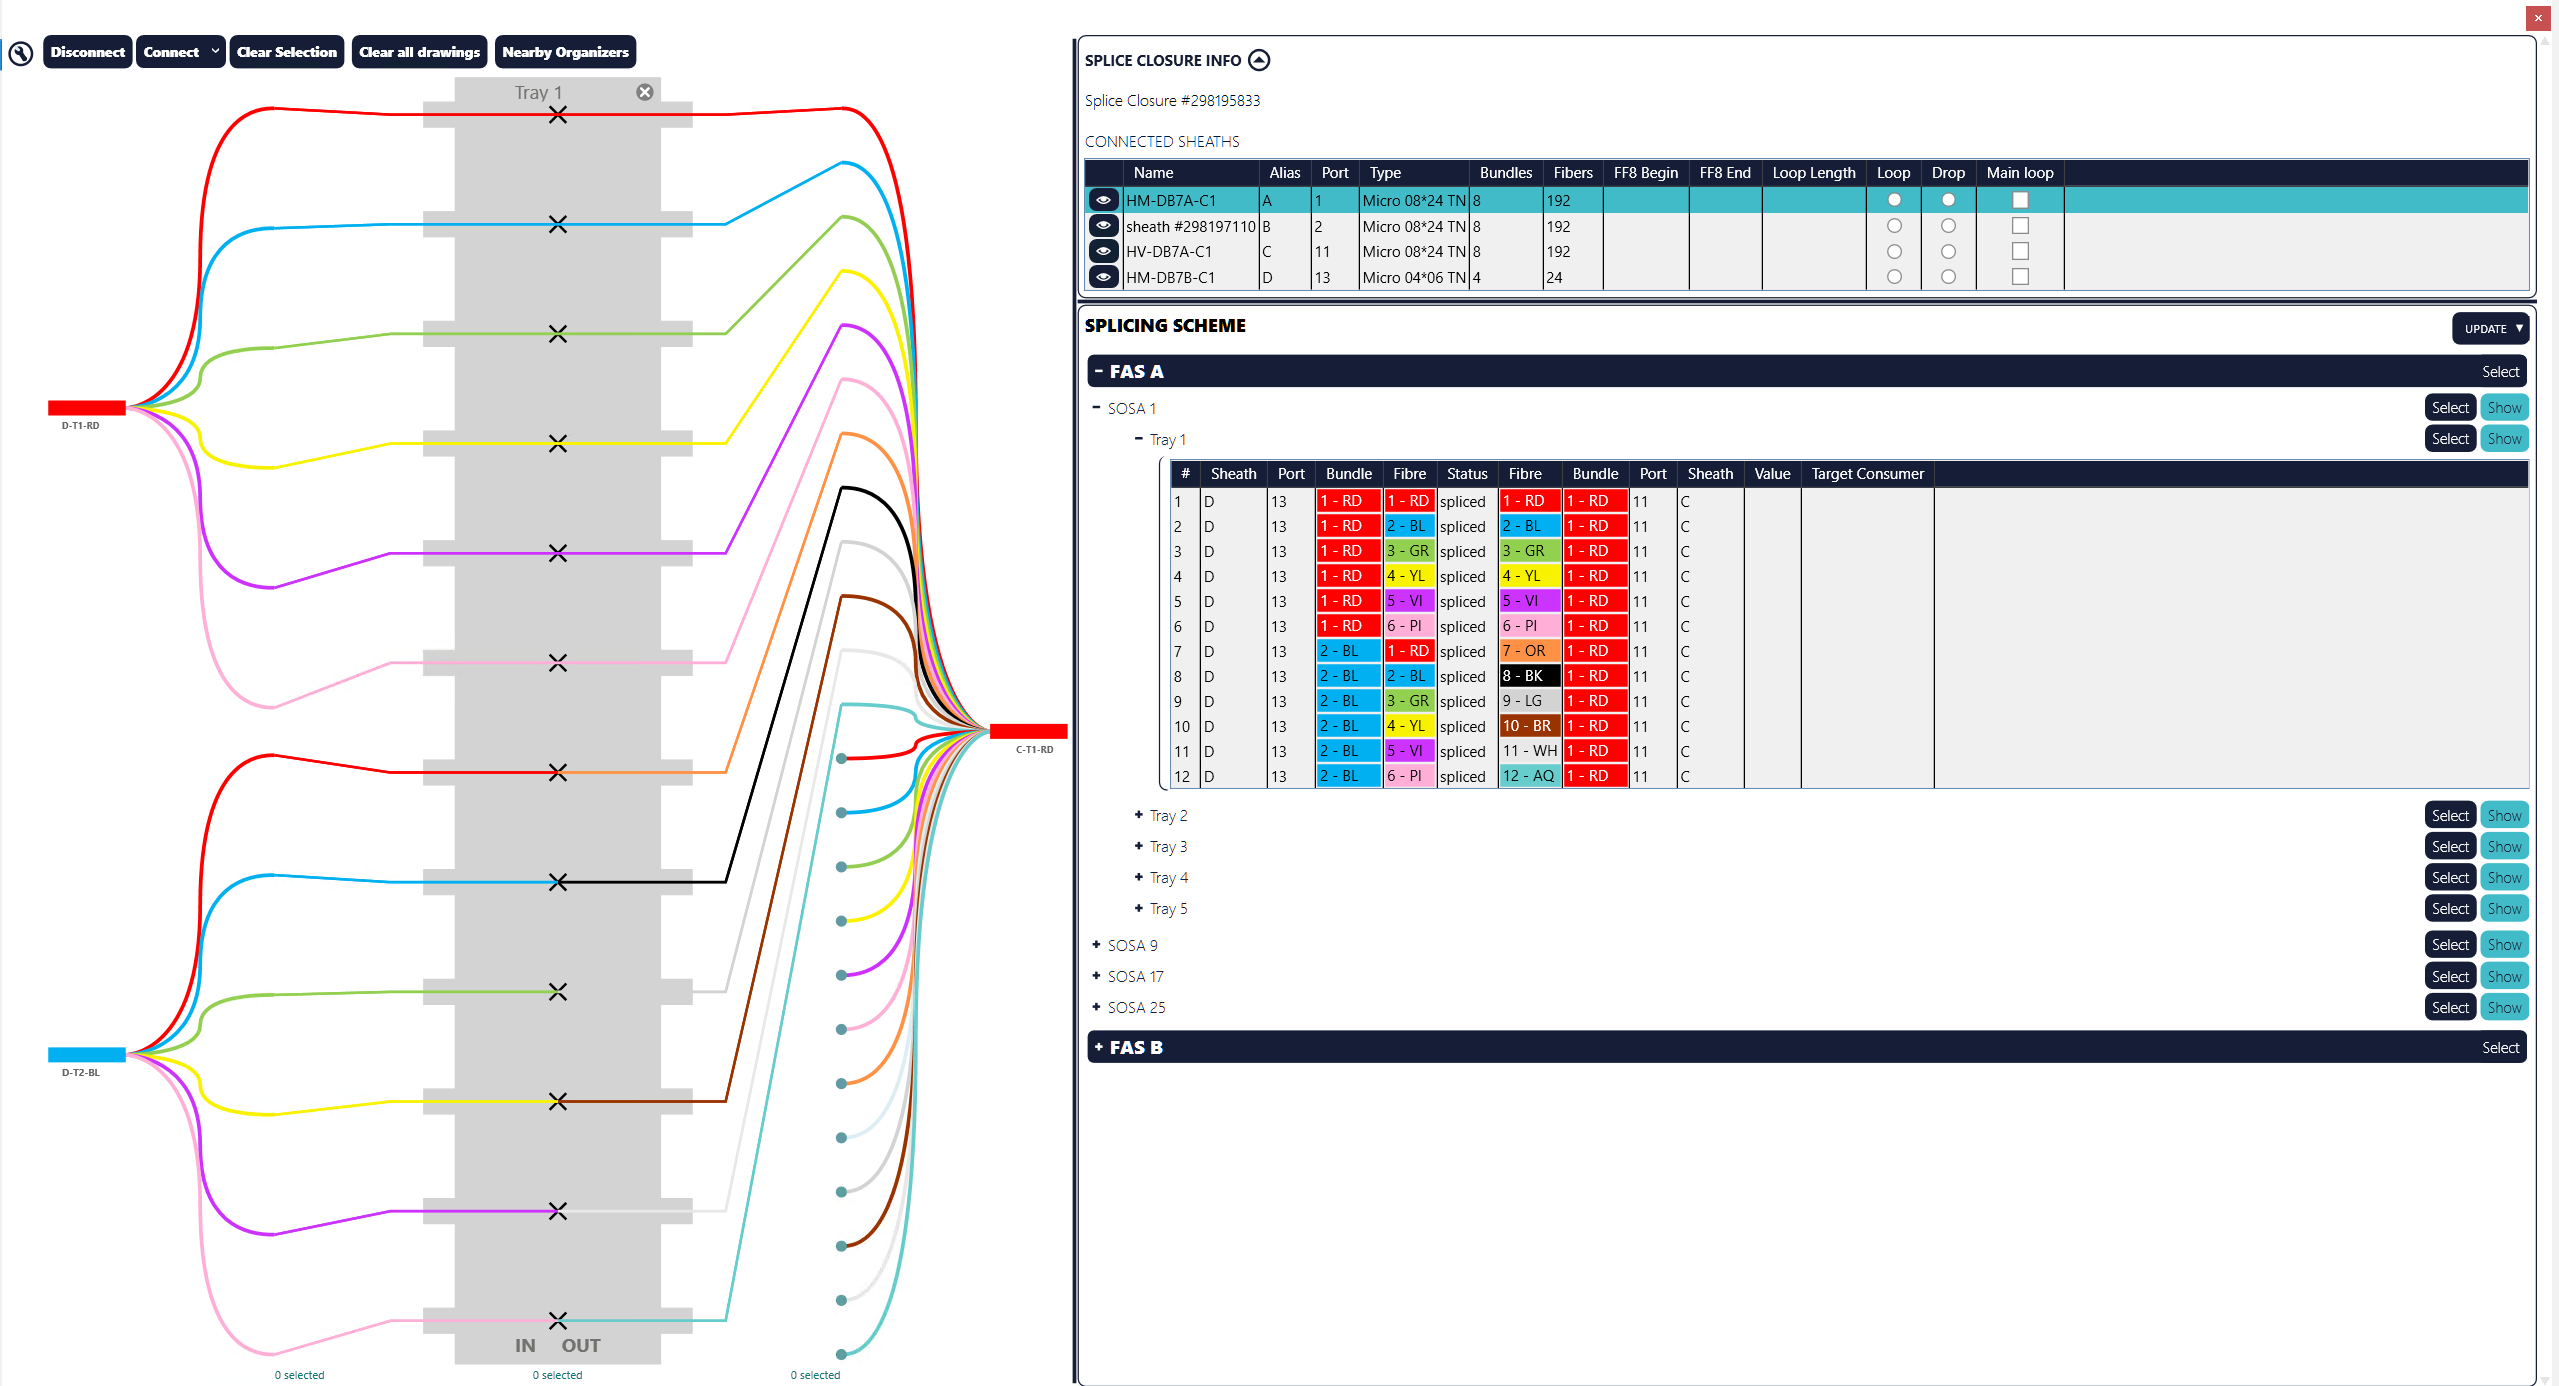
Here you see the power of on-the-fly generated schematics: fiber connections in the splice closure.
A graphical (left) and tabular (right) view supports you in understanding the splicing. Of course, if you click on a fiber, it will be highlighted on the map. All Dynamic Views are visible on the Desktop and Web/Mobile solutions and can be configured and extended.
As-built Documentation
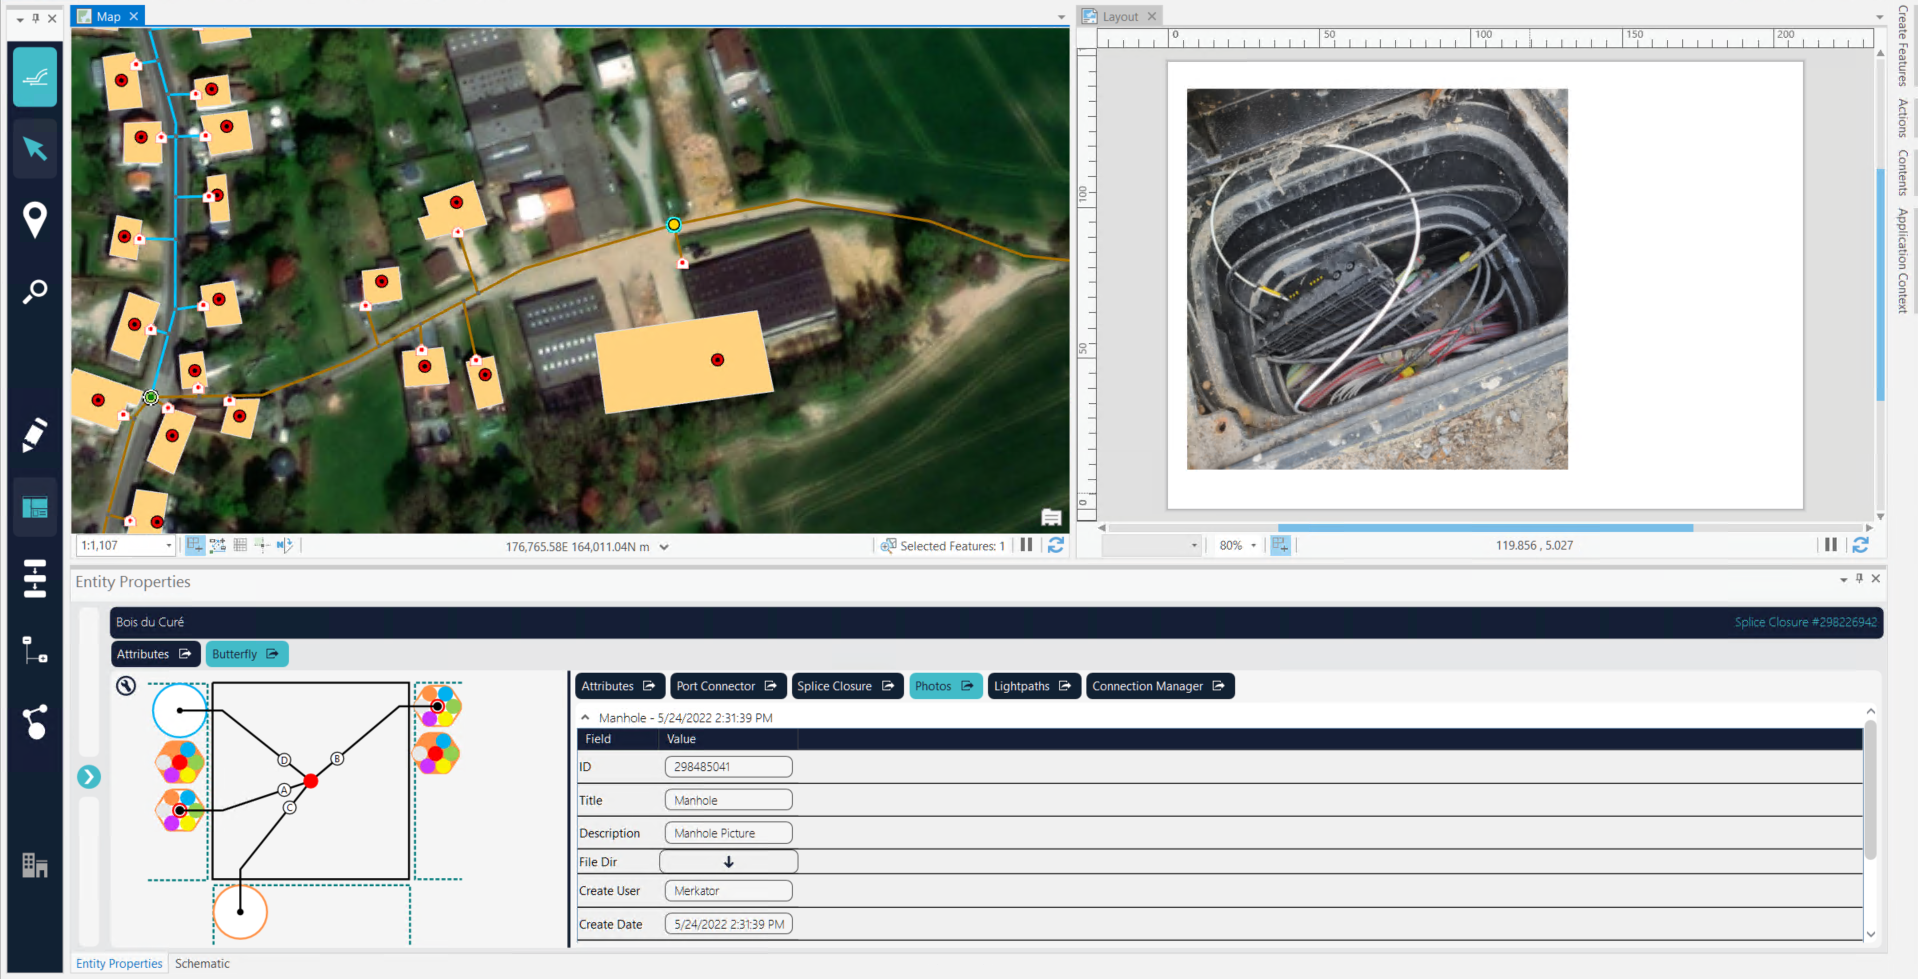
Field technicians often have the most precise view of network elements, having a true ‘hands-on’ experience with day to day
operations and maintenance. Marlin extends the power of network updates to the browser – with Marlin Web, other stakeholders have the opportunity to update supplemental network information, such as the ability to attach pictures to document their updates – all in one place.
Marlin Flows
With some GIS tools, you become a bit overwhelmed with tools and icons which may have little relevance to the task you are attempting to perform. Marlin offers Flows to guide you through specific tasks, including placing elements, establishing connectivity and of course populating required attributes.
You will enjoy an easier user experience and data input will be corrected and validated, which minimizes opportunities for small errors during input. You’ll be far more efficient and data quality will dramatically increase.
Flows are also fully configurable – to conform to your business rules and established workflows. Marlin provides the framework, you choose the options that are presented to your users.
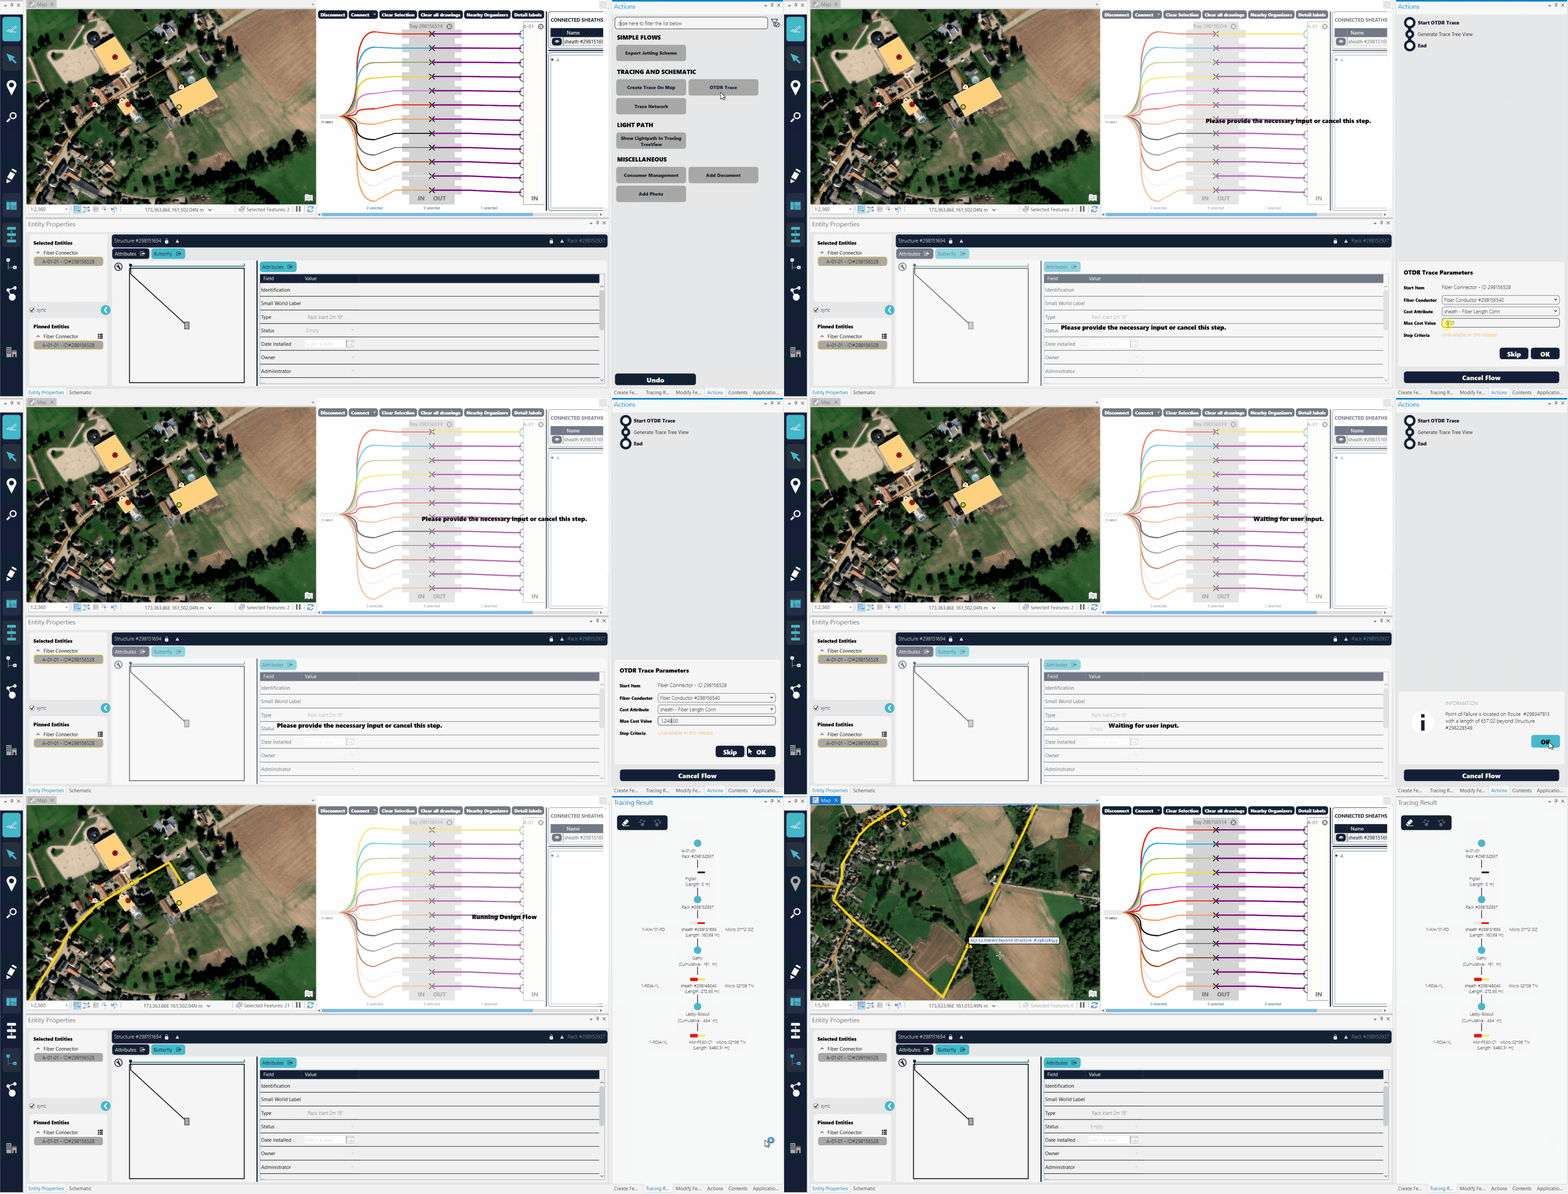
In this example, you select the OTDR Trace flow from the list, to understand where the fault in your cable is. From the OTDR report, you see a problem in your fiber after 1248m. But, where exactly is this location on the map?
Select the fiber with the error (in this case, the top fiber), select your Flow (OTDR Trace) and enter the distance. Marlin guides you to the location of the error.
Automation
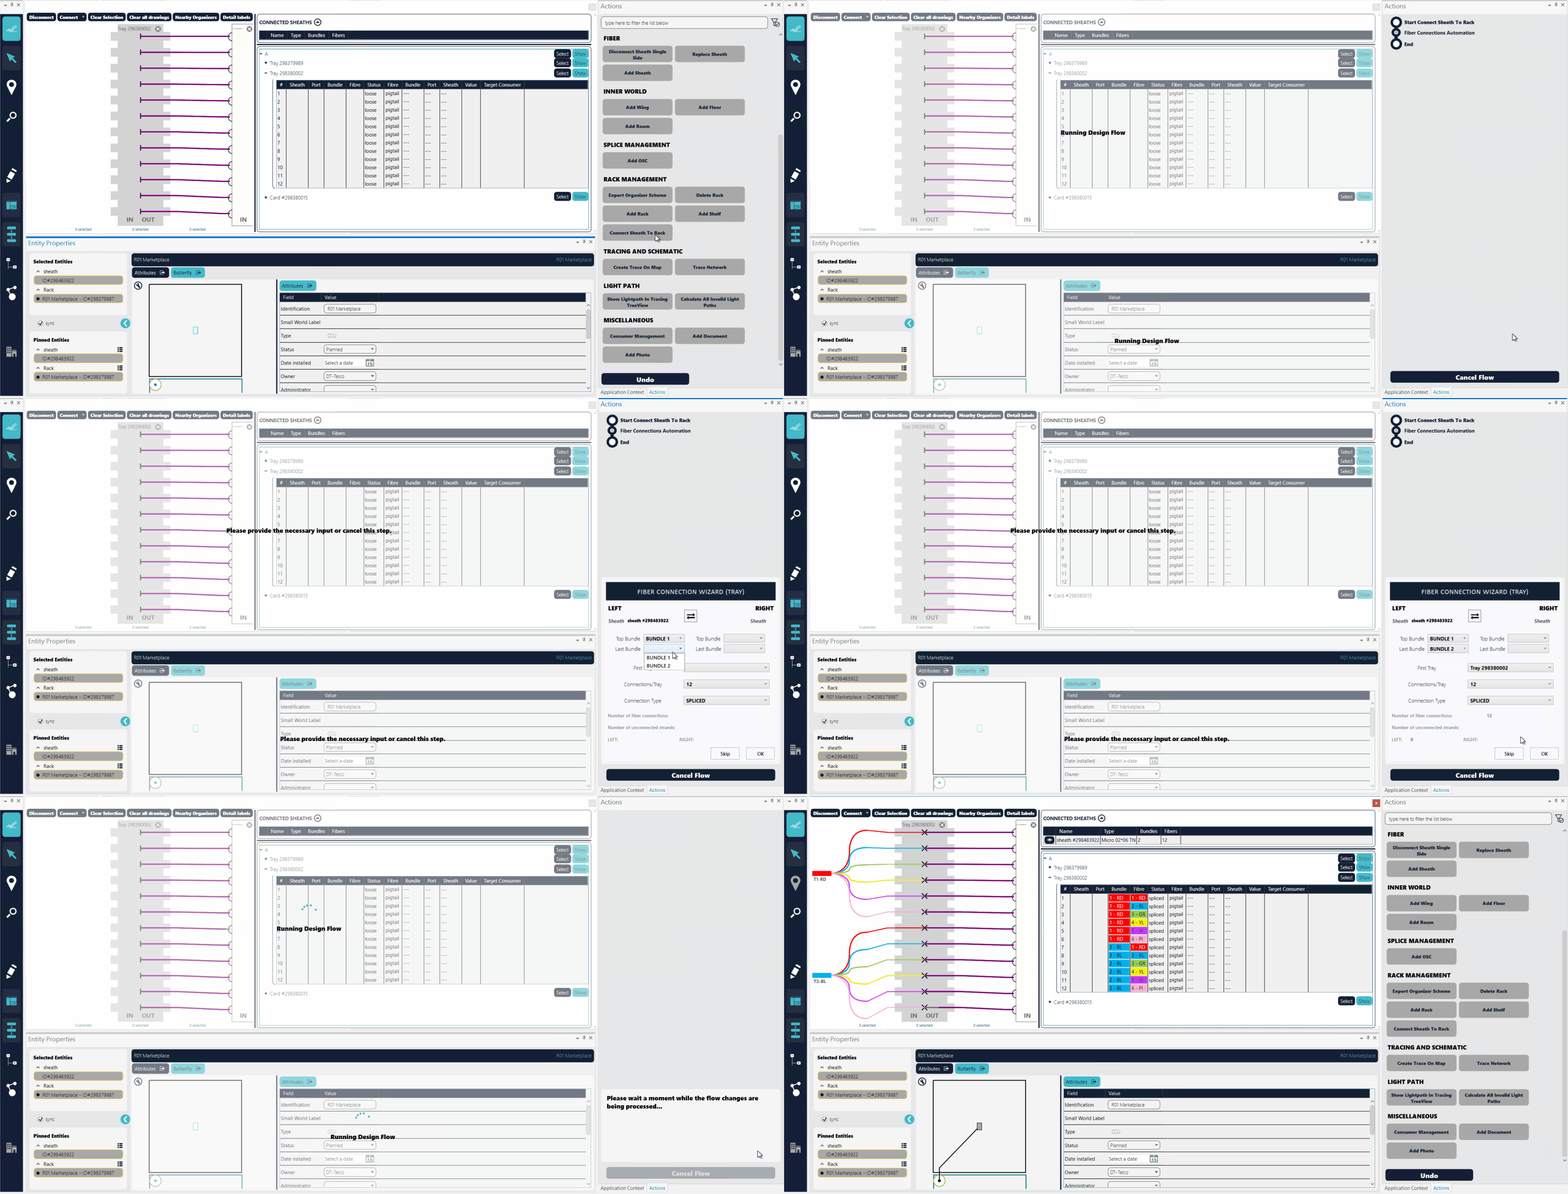
In this example, you connect a cable to the rack inside a building. As the cable has 12 fibers, you would need to manually connect the 12 fibers to the rack.
Luckily, the Marlin Flow will automate this time-consuming and error prone process! Select your flow, select your bundles, select the tray and Marlin will connect them for you.
Using Flows with Automation will elevate data quality as there is no room for human error. With high data quality, the schematics can be generated on-the-fly and the Dynamic Views are always up-to-date: for the desktop, web, mobile solutions.
Input Validation
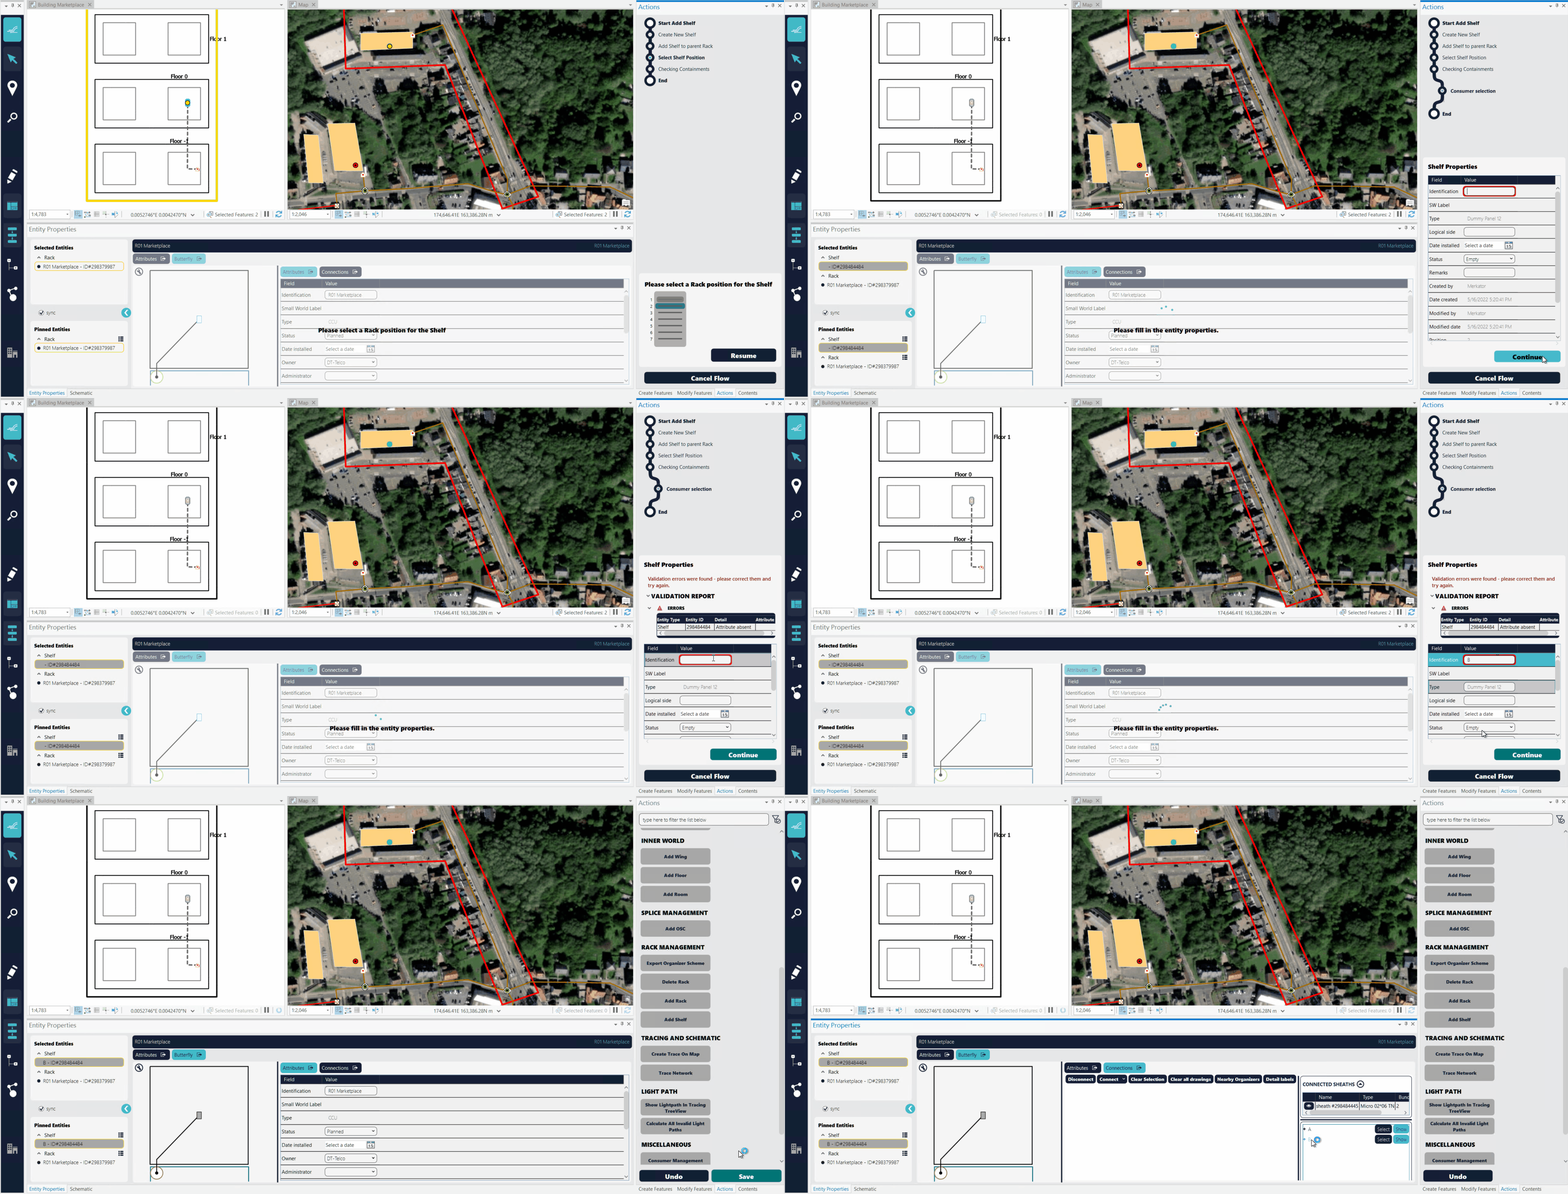
Flows truly minimize opportunities for typos and mistakes that create unreliable data by adding input validation: checking if the input of the users matches the expectations.
In this example, the user adds a shelf to a rack by following the Add Shelf Flow (easy, right?). However, if the user forgets a mandatory field, Marlin notifies the user to correct the error – ensuring data integrity.
Safeguarded editing and approval process
Flows can be much more powerful, for example to support the editing process. Marlin uses Edit-Sessions: you define the project area, manage project states (draft, design, commissioning, as-built, …) and Marlin makes sure that no other users can interfere with your project.
Edit-Sessions keep track of the full history of your CRUD action so you can easily undo, rollback to a savepoint and more without impacting your colleagues.
When you are ready with your design or edits, you can post the data to production. Your Edit-Session could go through the various “project states” and can only be posted after validation of “a manager” and has many validation checks. We strongly believe our Edit-Sessions will improve the accuracy of your data while reducing the training requirements for your users.
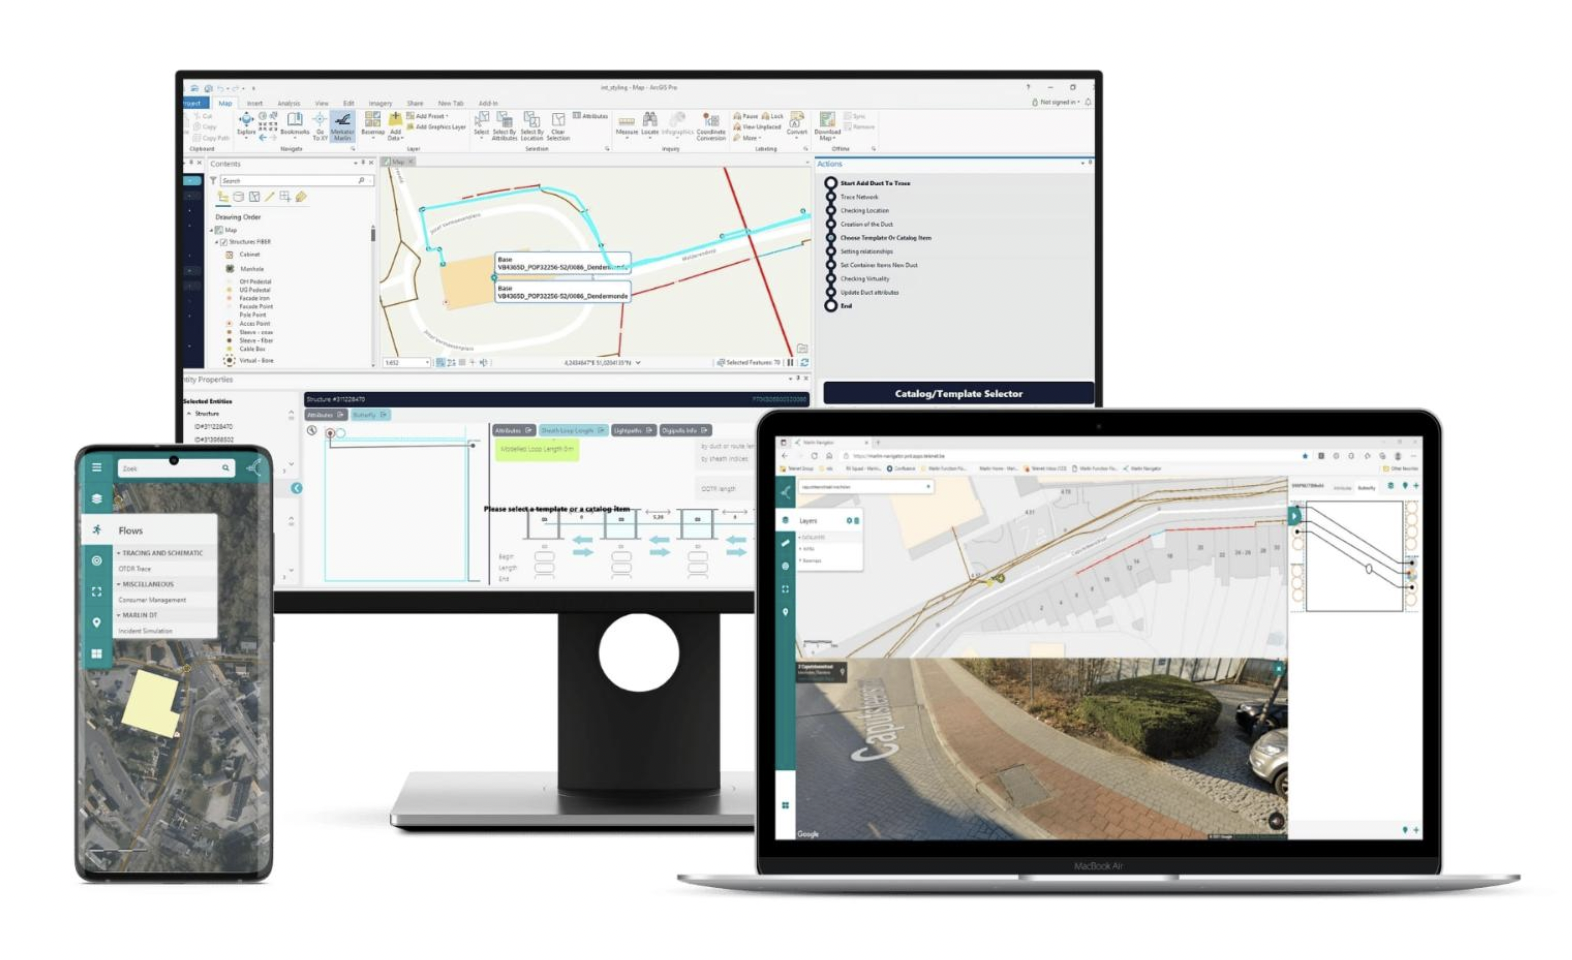
Marlin Solutions
Marlin is a solution designed and built by the people of Merkator Belgium. Our team consists of experienced telecom, utility and GIS engineers, with years of experience in inventory solutions. We have experienced first hand that inventory solutions can slow down the operations and engineering teams. We decided to improve the status quo and provide the tooling to improve utility network engineering: Marlin GIS Inventory was born.
Bridging Physical and Logical Inventory
Next to physical or passive GIS inventory, we also offer an integrated Operational Inventory for active/logical infrastructure to bridge the gap between engineering and operations.
Marlin Solutions on the Esri Foundation
The Marlin Desktop solution builds on ArcGIS Pro. The Marlin Web and Mobile solutions leverage the ArcGIS Enterprise to access the network data, views and flows from mobile devices. The Marlin API enables an integration into the eco-system of the operator. The Marlin Management Console enables the configuration of Marlin by partners and/or the customer (configugration of Flows, Views, Roles&Rights, …).

